People search "stockout rate" after the third time in a month someone asked "when is the 8 back in stock." The store feels fine. Revenue is fine. But the same question keeps arriving, and nobody can say how much it costs, because the miss never shows up in a report. Sold units get counted. Units that would have sold do not.
A stockout is invisible by default. Measuring it means choosing a definition and holding it still. Most teams quote three different ones in the same conversation and wonder why the number moves.
This page is about getting one honest number. What that number costs in ad spend and margin is a different piece of work, and buying to prevent it is safety stock territory.
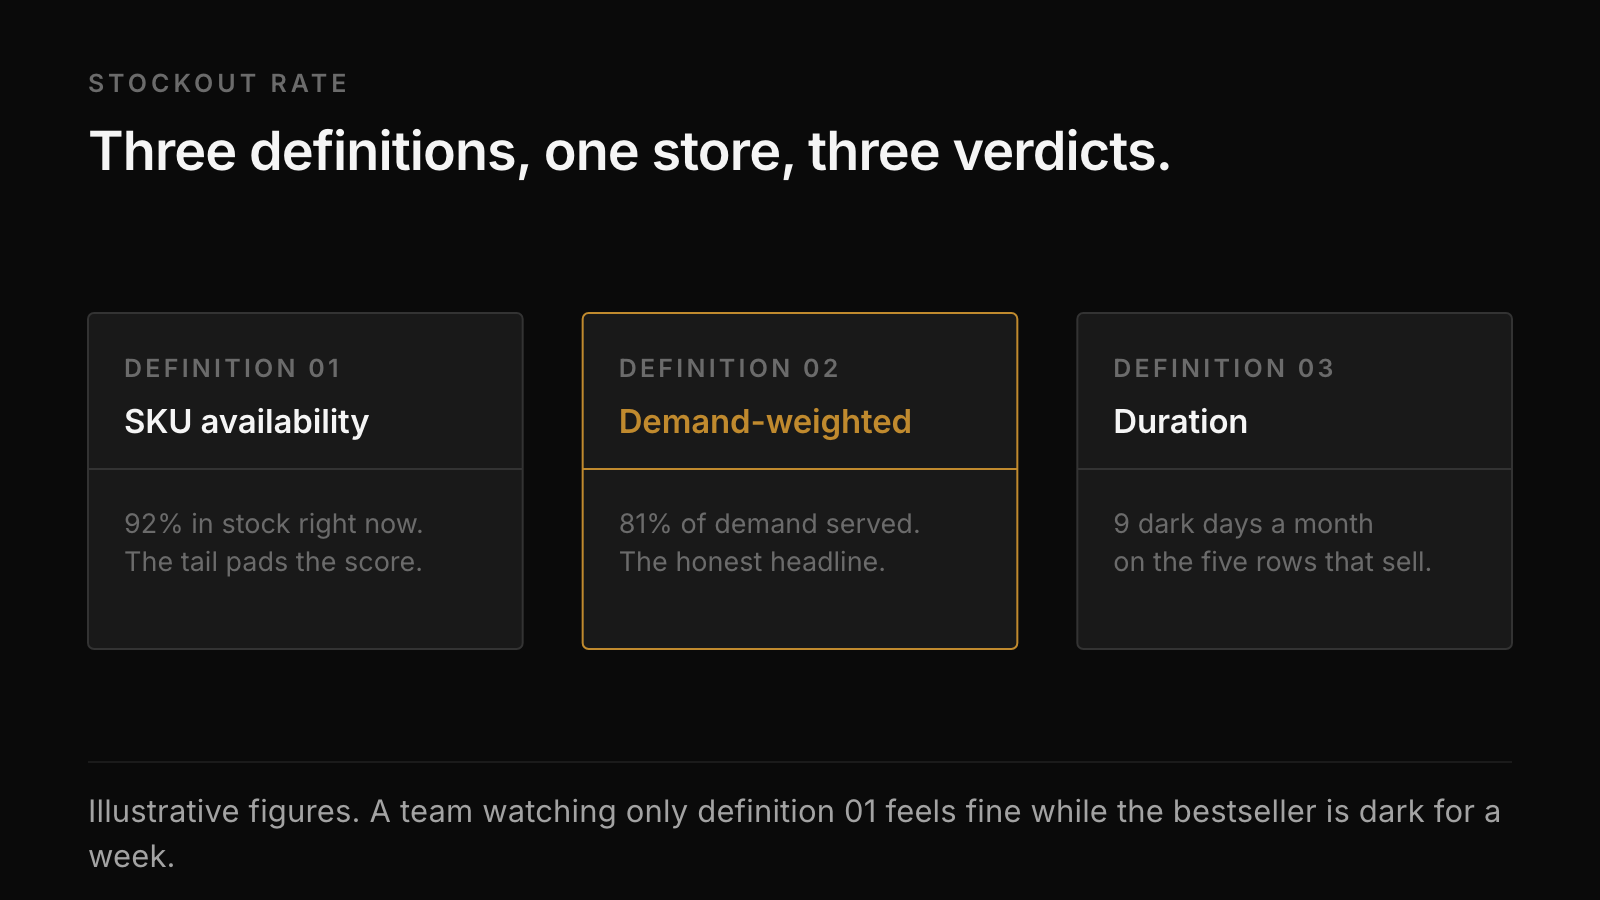
Three numbers that all claim the name
SKU availability. Share of active SKUs in stock right now. Easy to compute and nearly meaningless. A store with 92% availability can be missing its top seller. The tail pads the score.
Demand-weighted availability. Share of demand that lands on an in-stock page. Weight each SKU by its recent sales rate or its traffic. This is the honest one. If the size that sells is empty, the number drops hard, because the demand was pointed at that exact row.
Stockout duration. Days out of stock per SKU per period. This is the operational cut. It tells you which rows keep going empty and for how long, which is what a reorder fix needs.
Pick demand-weighted availability as the headline and duration as the working list. Report them together. A team that only watches SKU availability will feel good while the bestseller is dark for a week.
The grain decides whether the number is real
Shopify says a product is "in stock" if any variant has units. The customer wanted one variant. A tee live in XS and XXL and empty in M and L is, for most of the demand, out of stock. The same trap holds for shades, sizes of candles, and pack counts of supplements.
Compute at variant level or the number flatters you. The same applies across locations: units in a warehouse that cannot ship to the customer's region are not availability, and if you sell on more than one channel, a unit can be promised twice. Multichannel sync is its own failure mode, and it shows up here as phantom availability: the ledger says yes, the shelf says no.
The ledger itself can lie too. If the on-hand count is wrong, availability is fiction at any grain. That is a perpetual inventory problem, and no stockout metric survives it.
A weekly read you can run
You need variant-level stock history and sales rates. A spreadsheet does it at small catalogue sizes.
- Snapshot on-hand units per variant daily. Shopify's inventory export, scheduled, is enough.
- For each variant, compute expected daily demand from the last four in-stock weeks.
- Each day a variant sits at zero, log its expected demand as missed units.
- End of week: demand-weighted availability is expected demand served over total expected demand. Missed units times contribution per unit is the week's stockout bill.
- Rank variants by missed units. The top five rows are the reorder conversation.
The bill is an estimate. Demand during a stockout is not zero for the store; some of it substitutes to another size or product, some waits, most leaves. Do not let that nuance stall the read. Even the unadjusted number ends the "is this a real problem" argument, because it moves in one direction: the rows you keep missing are the rows that sell.
What a good rate looks like
On demand-weighted availability, strong replenishment stores hold 97% and up. Seasonal drops run lower on purpose at the end of a run: selling out is the plan. That is the judgment part. A stockout on a core replenishment SKU is a process failure. A stockout on the last week of a limited run is a clean exit.
So split the catalogue before setting the target. Core rows get a floor and a reorder discipline. Drop rows get an exit date. One number across both is how stores end up proud of an average that mixes a failure with a plan. Averages hiding the answer is the same disease as in inventory turnover; the cure is always the same grain.
What's missing
This page can define the number and hand you the weekly read. It cannot watch your variants go dark on a Tuesday and log the demand that hit the empty page, because that requires your stock history at variant grain, kept continuously.
That watching is what SkuSense is being built to do for Shopify brands: demand-weighted availability, the missed-units list, and the stockout bill, running in the background.
Related: Safety stock and reorder points · Multichannel inventory sync · Perpetual inventory for ecommerce