People search "safety stock formula" the week after a bestseller went dark. The reorder went in on time, the supplier slipped nine days, and the page sat empty through the exact window the ads were paid for. Someone promises a formula will prevent the next one.
The formula is famous. Safety stock is z times the standard deviation of demand over lead time. Reorder point is average demand times lead time, plus that buffer. Two lines. You can set both in an afternoon.
The afternoon is not the problem. The inputs are. Every term in those two lines is a guess wearing a number, and the formula is only as honest as its worst input.
What the buffer is actually for
Safety stock exists because two things vary: how fast you sell during the wait, and how long the wait is. The buffer absorbs the bad draw where both go against you in the same cycle.
That framing matters because it says what safety stock is not. It is not cover for a fading product, and it is not a fix for a wrong on-hand count. If the ledger says 40 and the shelf holds 12, no buffer computed on the 40 will save you. That is a perpetual inventory problem. Fix the count first or the maths is decoration.
Where the textbook inputs lie
Demand is not normal. The formula assumes demand wobbles gently around an average. Ecommerce demand spikes: a creator posts, an email lands, a competitor stocks out. The standard deviation of a spiky series understates the tail you are buffering against. A z of 1.65 promises 95% service on paper and delivers less on a catalogue that spikes.
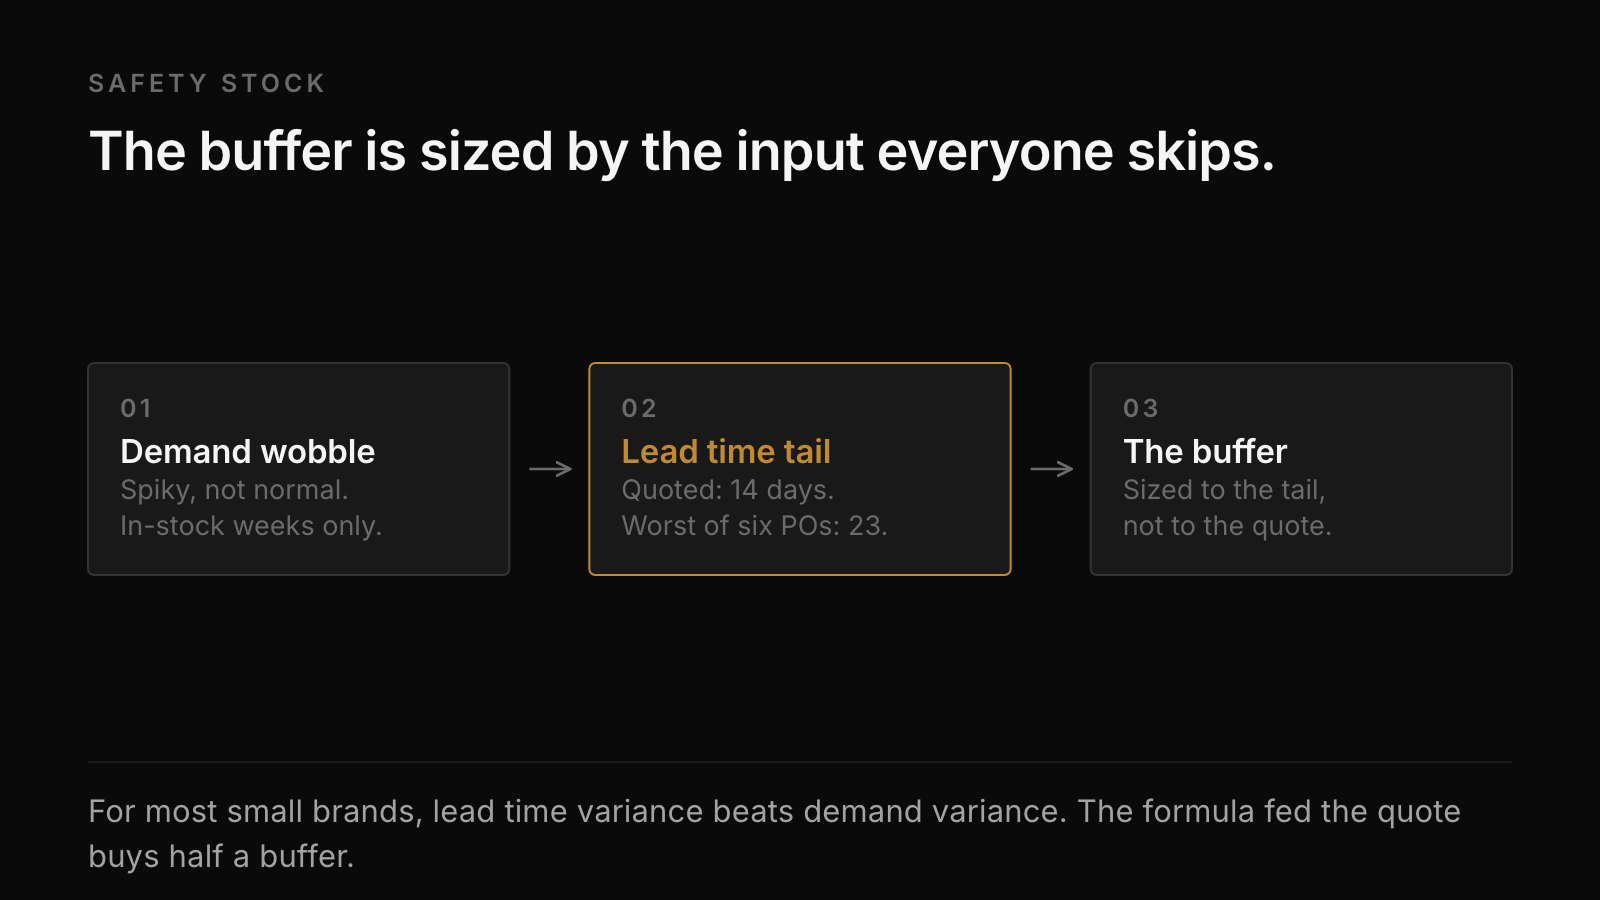
Lead time varies more than demand. Most operators feed the formula their supplier's quoted lead time. The quote is a hope. The real distribution has a long right tail: the nine-day slip, the customs hold, the factory holiday. For most small brands, lead time variance dominates demand variance, and the version of the formula that ignores it produces buffers that are half the size they need to be.
The average is stale. Demand over the last 90 days includes the stockout you just had, which suppressed sales, which lowers the computed demand, which shrinks the next buffer. Stockouts poison the very average that is supposed to prevent them. Use in-stock days only when computing the rate, or the formula learns to repeat the miss. The same correction matters in demand forecasting generally.
A setup that survives contact
Run it per SKU, and only for the rows that deserve it.
- Split the catalogue. Replenishment cores get reorder points. Seasonal drops get an exit plan instead; a buffer on a dying product is a donation to the markdown pile.
- For each core row, take the last six actual lead times from purchase orders. Not the quote. Use the worst of the six as the planning lead time until you have enough history for percentiles.
- Compute demand per day from in-stock days over the last 8 to 12 weeks.
- Reorder point: demand per day times planning lead time, plus a buffer of the same demand rate times the gap between the median and worst lead time. Crude, honest, and it prices the input that actually bites.
- Reorder quantity: enough to cover the order cycle without dragging days of inventory past your cash comfort on that row.
Then check the trigger weekly. A reorder point nobody compares against on-hand is a number in a spreadsheet, and on-hand drifting below trigger between checks is how "we have a system" stores still hit empty pages. Your stockout rate is the scoreboard that says whether the setup is working.
The service level nobody chose
Every store runs a service level. Most never chose it. The buffer you happen to hold implies a probability of going empty during lead time, whether or not anyone computed it.
Choosing is better, and the choice is commercial. A hero SKU that carries the ads deserves 98% and the cash that costs. A B-list colourway can run at 85% and the occasional miss is cheaper than the cover. Set the level per row, from contribution and substitutability. One store-wide service level is the same averaging mistake as one store-wide turnover target: it overprotects the tail and underprotects the head.
What's missing
This page can give you the setup and name the inputs that lie. It cannot know your suppliers' real lead-time tails or which of your rows crossed its trigger this morning. That is your purchase-order history and your daily on-hand, read continuously.
SkuSense is being built to run exactly that for Shopify brands: real lead times from your history, per-SKU triggers, and a flag the day a row crosses one.
Related: Stockout rate in ecommerce · Demand forecasting for ecommerce · Days of inventory outstanding