People search "what is a good inventory turnover ratio" after someone quotes one in a meeting. An investor asks why it is 2. A blog says 4 to 6. A supplier says fashion runs 8. Everyone is sure. Nobody says at what grain, over what window, or what the number cost.
Turnover is cost of goods sold over average inventory value, per period. That is the whole formula. The judgment is everything around it: which units are in the average, which window you read, and what a "good" number commits you to buy.
Days of inventory outstanding is the same fraction upside down, read in days. This page stays on the ratio: what it counts, where the store average lies, and the read that actually changes a buying decision.
This is not an accounting textbook page.
What the ratio counts
Write your version of the fraction down before you compare it to anything.
- numerator: COGS for the window, or revenue if you are being generous with yourself
- denominator: average inventory at cost, opening and closing averaged, or a monthly average
- window: trailing 12 months, a quarter, or a season
A store that computes turnover on revenue over inventory at cost will look roughly twice as healthy as one on COGS. Both will quote "turnover" in the same meeting. Hold your fraction still before you read any benchmark.
The window matters as much. A Q4-heavy store reads 6 on the year and 2 in the summer. Neither number is wrong. They are different questions.
Why the benchmark answer disappoints
The honest generic answer is a range: most healthy DTC stores land somewhere between 2 and 6 turns a year, replenishment-heavy categories higher, seasonal and high-ticket categories lower. Grocery runs past 12. Furniture crawls below 2.
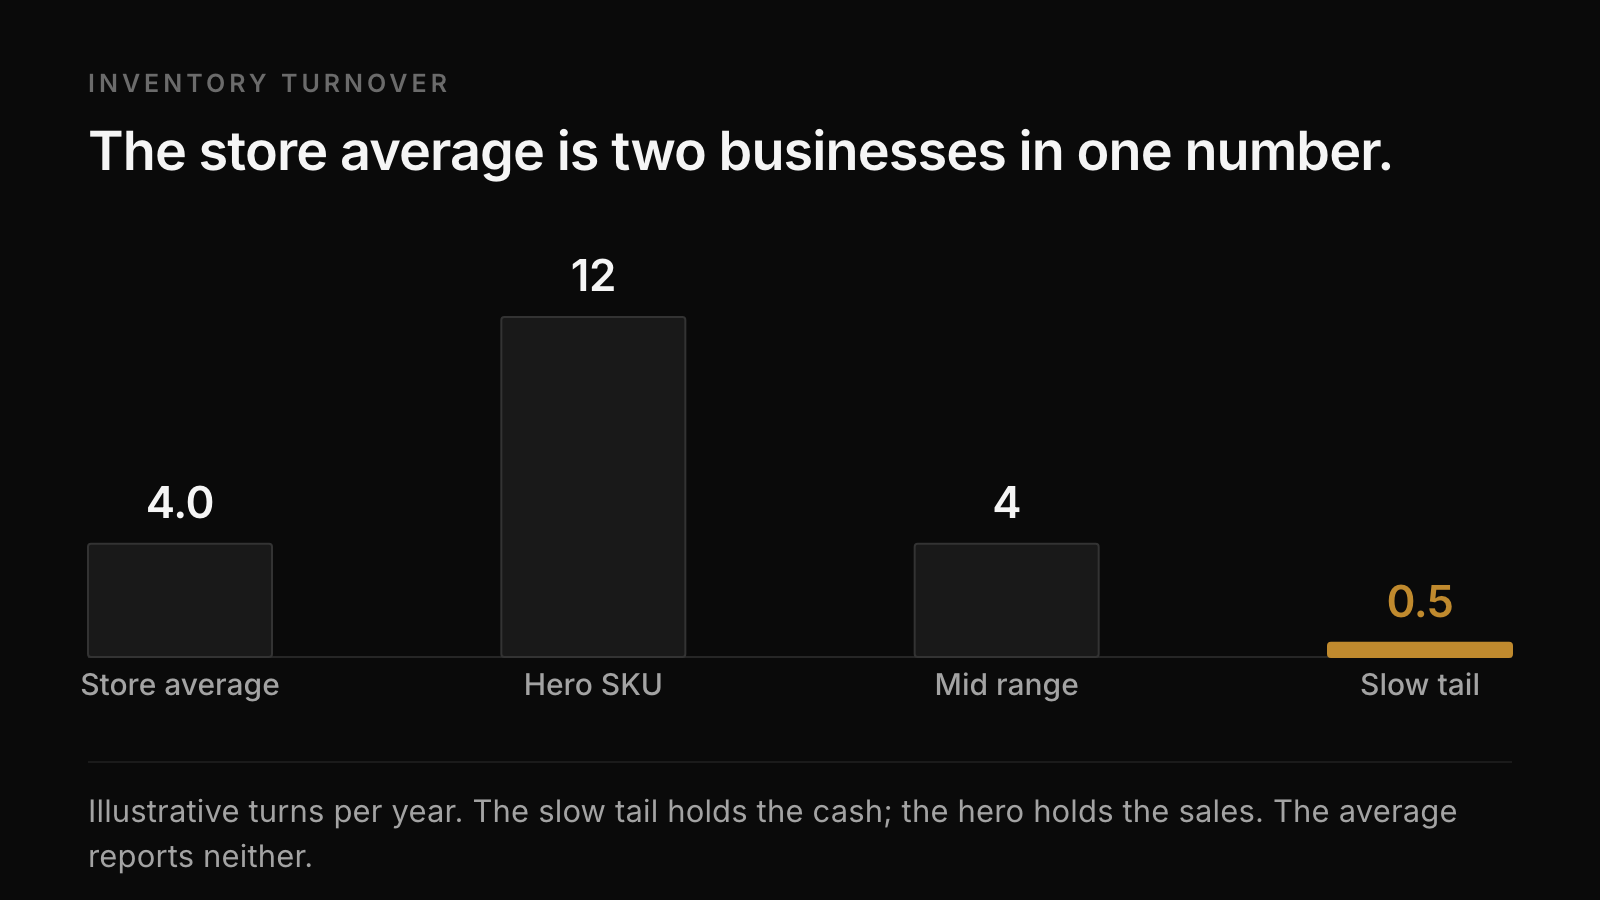
That range is real and it is almost useless, because turnover is a store-level average and the store average is where the information dies. A store at 4 can be a hero SKU turning 12 and a tail of dead sizes turning 0.5. Another store at 4 can be forty SKUs all turning 4. Same ratio. Completely different businesses. The first one has a buying problem wearing a healthy average.
If you only remember one thing: a good turnover ratio at store level does not exist. A good distribution of per-SKU turns does.
What a high number costs
Turnover is not a score you maximise. Every turn you add has a price somewhere else.
A store that turns 10 is holding thin cover. Thin cover misses. A restock that lands a week late is a stockout on the size that sells, and the ad spend that week lands on an empty page. Chasing turns with smaller, more frequent orders also walks you out of supplier price breaks and into more freight.
A store that turns 2 is financing shelves. Cash sits in units that will not move until you cut price. The slow half of that stock is quietly becoming dead stock, and the markdown that clears it will eat the margin the fast half earned.
The good number is the one where holding cost, stockout cost, and order cost balance for your catalogue. That balance lives at SKU level, never at store level.
The read that changes a decision
You do not need new software for a first read. You need an export and an hour.
- Pull 12 months of sales at cost and current stock value per SKU. Shopify reports plus a cost column get you there.
- Compute turns per SKU: annual COGS over average stock value. Where you cannot get average, current value is an honest start.
- Sort by stock value, descending. Read the top 20 rows.
- Mark every row holding more than eight weeks of cover while turning below your store average.
That marked list is the real answer to "is my turnover good." It is the cash you could reclaim without touching the SKUs that earn. Reorder decisions for the fast rows are a different read: safety stock and reorder points covers the pair.
If the marked list is empty and your customers are not hitting empty pages, your turnover is good, whatever the blog benchmarks say.
Where the number moves next
Turnover degrades quietly. A reorder lands heavy, a trend fades, and the ratio takes months to show it because the average smooths the damage. By the time store-level turnover drops, the slow stock is old.
Watch the per-SKU turns monthly, not the store ratio quarterly. The early signal is a SKU whose weeks of cover grows two months in a row while its sales rate falls. That SKU is on its way to the markdown pile, and demand forecasting is only as good as catching that turn early.
What's missing
This page can give you the fraction, the trade-offs, and a one-hour read. It cannot see which of your SKUs is quietly going long, because that read lives on your numbers at SKU grain, refreshed every week.
That continuous read is the product SkuSense is being built to do for Shopify brands: per-SKU turns, cover, and the early drift, watched so you do not have to run the export.
Related: Days of inventory outstanding · Dead stock in ecommerce · Safety stock and reorder points