People search "demand forecasting" in two moods. Either a stockout or a dead pile just cost real money and forecasting is the promised cure, or a vendor demo showed a smooth line into the future and it looked like knowing.
Start with the honest sentence: for a small catalogue, most SKU-level demand is barely predictable, and the businesses that win at this are not the ones with the cleverest model. They are the ones who know which rows are predictable, forecast those, and hold buffers or option value on the rest.
A forecast is not knowing. It is a bet with error bars, and the error bars are the useful part, because they size the safety stock that absorbs the miss.
What is predictable and what is not
Rank your rows by how much history behaves.
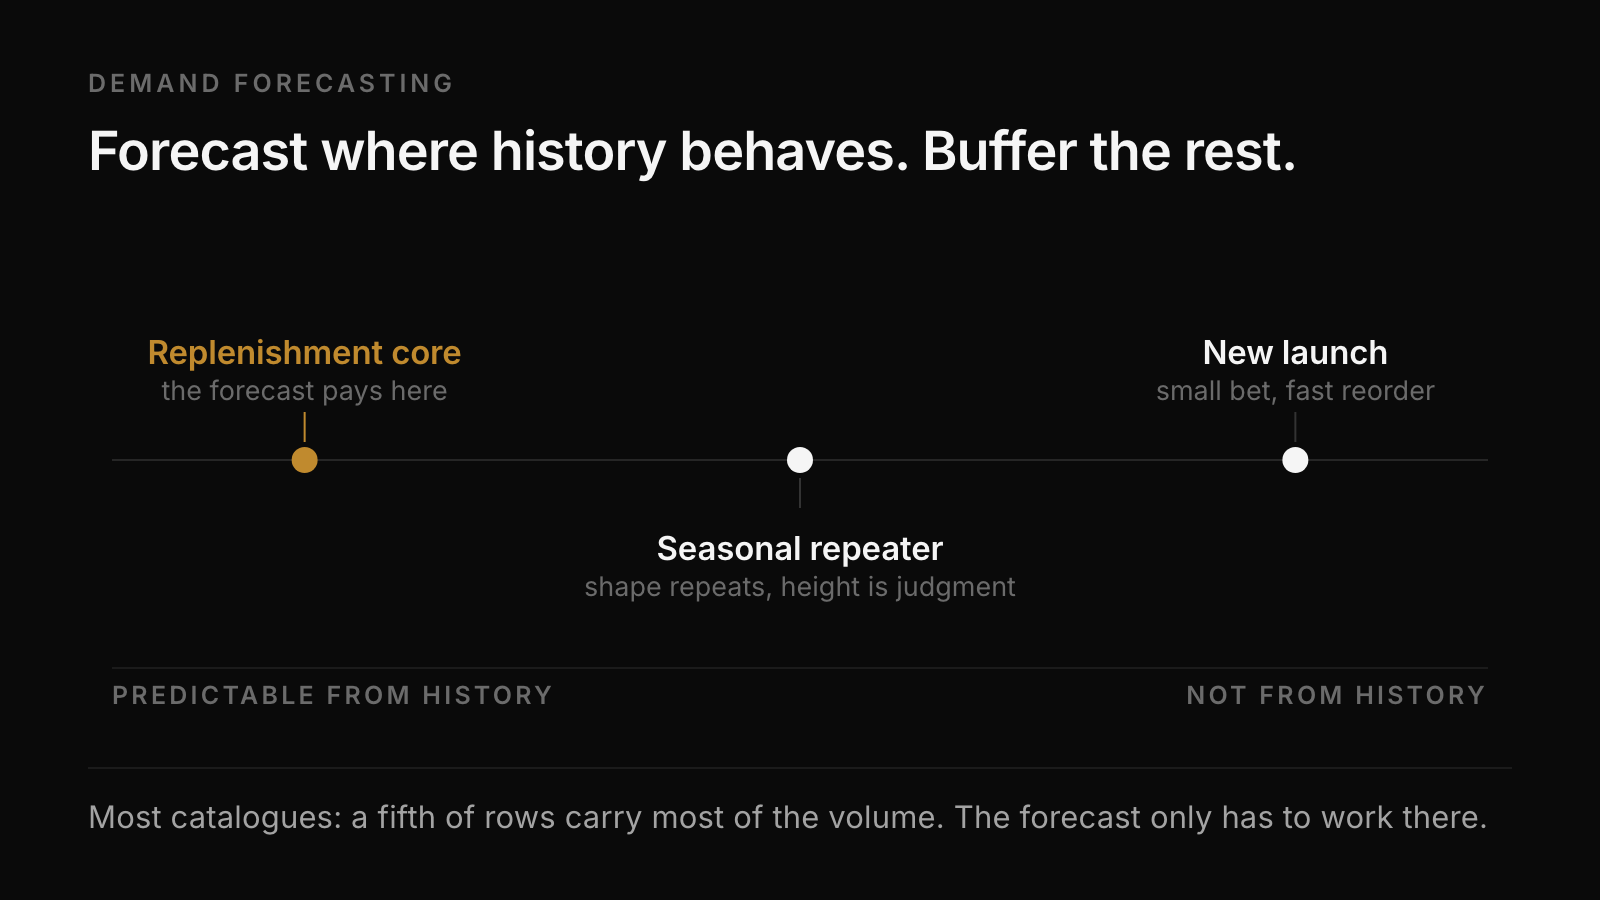
Predictable enough: replenishment cores with a year of steady sales, mild seasonality, no stockout gaps. Weekly demand next month looks like weekly demand last month, adjusted for season. This is where a forecast pays.
Partly predictable: seasonal repeaters. The shape repeats; the height does not. Last year says October will be three times August. Whether the level is up or down 30% is a judgment about this year's demand, marketing, and price.
Not predictable from history: new launches, trend items, anything that sells because a video moved. The history is too short or belongs to a different world. Forecasting these from their own past is astrology with a spreadsheet. Treat them as bets: small first buy, fast reorder, and a kill line, or they end up in the dead stock read.
Most catalogues are 20% predictable rows carrying 80% of unit volume. That asymmetry is good news. The forecast only has to work where it can.
Clean the history before any model sees it
The model matters less than the series it eats. Three corrections do most of the work.
Stockout gaps. Zero sales during a stockout is not zero demand. Leave it in and the model learns your worst weeks as normal. Compute rates from in-stock days, the same correction that keeps stockout rate honest.
Promo spikes. A flash sale week is not organic demand. Tag it. Either exclude it from the baseline or model promos separately. Untagged promos become phantom seasonality that predicts a spike next year on the anniversary of a discount.
Grain. Forecast at the grain you buy at. If you order by variant, a product-level forecast hides the size curve, and the size curve is where buys go wrong. Weekly beats daily for stores under thousands of orders; daily noise drowns the signal.
If the on-hand history itself is unreliable, fix that first. A forecast built on a ledger that drifts from the shelf inherits the drift; that is the perpetual inventory problem underneath every data problem.
A baseline you can run this month
Nothing here needs a data scientist.
- Pull two years of weekly unit sales per core variant, corrected as above.
- Baseline: average of the last eight in-stock weeks.
- Season: multiply by last year's ratio of the target month to the current month, if you have a full year of history.
- Trend: compare the last eight weeks to the prior eight. Carry at most half of that slope forward. Trends fade faster than spreadsheets extrapolate them.
- Error: for each row, keep the last few months of forecast versus actual. The typical miss, as a percentage, is that row's error bar, and it feeds the buffer maths directly.
That four-line forecast beats gut feel on the predictable rows, and on the unpredictable rows it fails honestly and fast, which is the most a model can do there. Measure it with one number: absolute miss over actual, per row, monthly. If a fancier tool cannot beat the four lines on your data, the tool is selling you its interface. Ask any vendor for exactly this comparison.
The forecast is for the buy
A forecast that does not change an order quantity is content. The chain is: forecast plus error bar sets the reorder point and buffer; the buy quantity balances cover against cash via days of inventory; and the miss log tells you which rows have earned tighter buffers.
Run that loop monthly and the forecast improves where it matters: not in accuracy points, in fewer empty pages and a smaller markdown pile.
What's missing
This page can sort your rows, clean your series, and hand you the baseline. It cannot run the loop: re-forecast weekly, track each row's miss, and move the buffers as the error bars move. That is a job for software sitting on your data.
SkuSense is being built to be that loop for Shopify brands: per-variant baselines, honest error bars, and buy suggestions that carry the caveat with the number.
Related: Safety stock and reorder points · Dead stock in ecommerce · Perpetual inventory for ecommerce