People search "days of inventory outstanding" from two different rooms. A finance person wants the working-capital line for a cash conversion cycle. A store owner wants to know if 74 days is bad. The formula is the same. The mistake is reading one room's number in the other room's meeting.
DIO is average inventory value over COGS, times the days in the period. It answers one question: how many days of cash are sitting on the shelf at the current sell rate.
It is inventory turnover upside down. Turnover 4 is roughly DIO 91. Same fraction, different unit. Finance likes days because days map to cash timing. Operators should like days too, but at a different grain.
This is not a working-capital lecture.
What the number is for
DIO earns its place in three sentences. It prices the shelf in time. It moves the cash conversion cycle line: days of inventory plus days of receivables minus days of payables. And its trend says whether the stock position is getting heavier or lighter relative to sales.
For an online store the receivables term is near zero and payables depend on supplier terms. Which means DIO is usually the whole cash story. A store with 74 days of inventory and 30-day supplier terms is financing 44 days of stock out of its own pocket. Growth makes that gap wider, because every new order is bigger than the last one.
That much the finance textbook gets right. The trouble starts when the number is used to run the stock.
Where the store-level cut misleads
The store-level DIO is an average across every SKU you hold, weighted by value. Averages hide the tails, and in inventory the tails are the whole game.
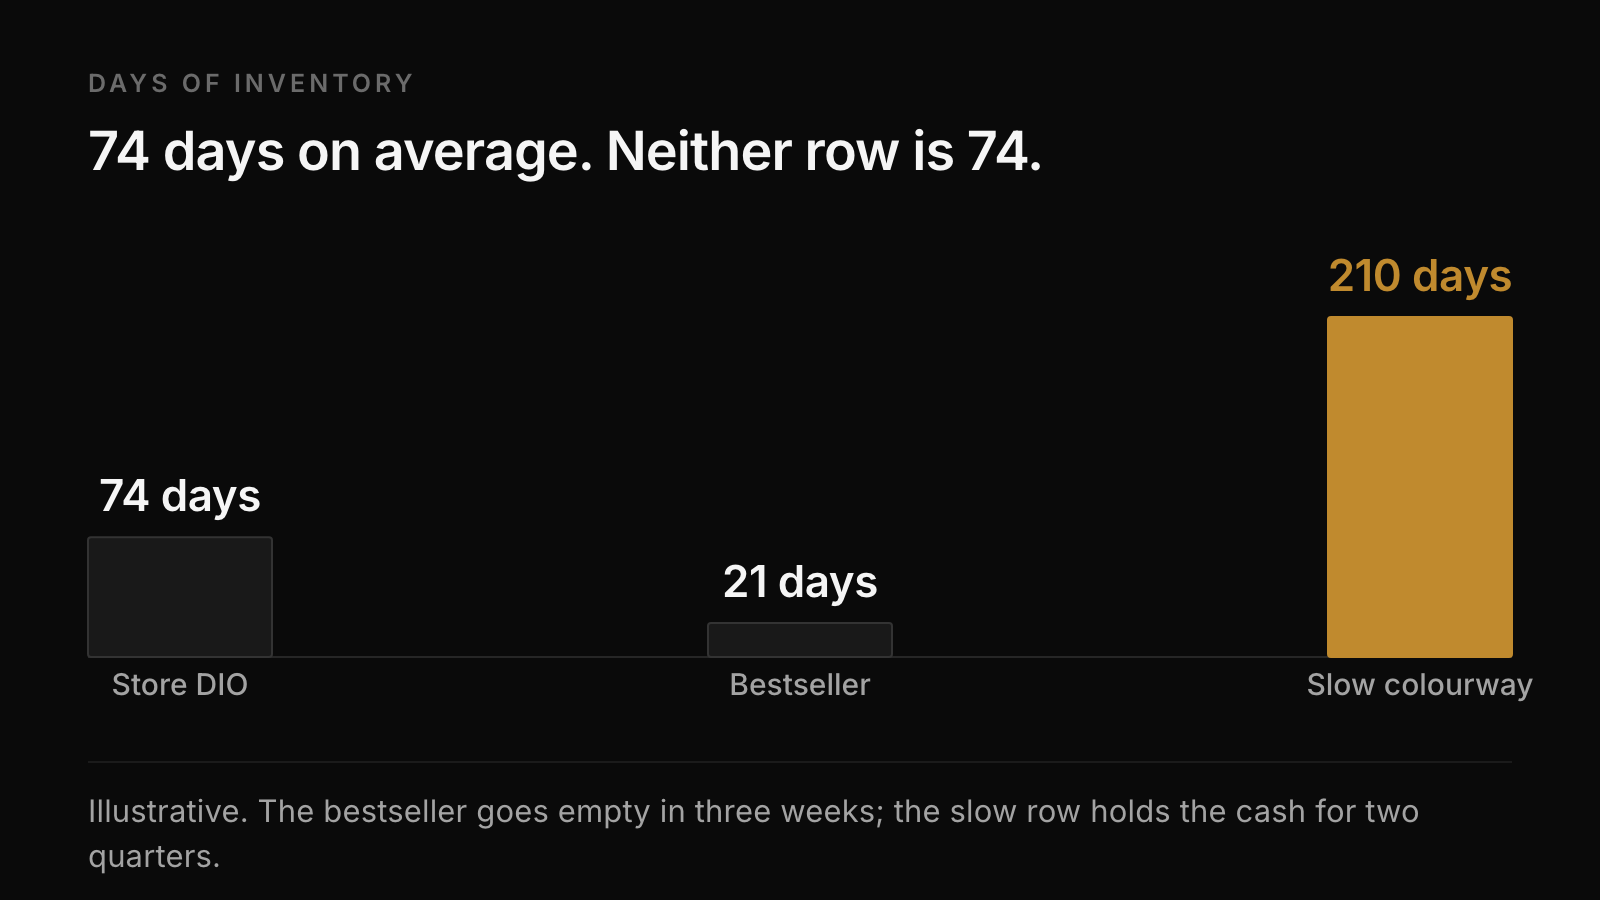
Say the store reads 74 days. Inside that: the bestseller holds 21 days and will hit an empty page in three weeks. A slow colourway holds 210 days and most of the cash. The average says "fine." Reality is a stockout forming on one row and dead stock already parked on another.
Seasonality bends it further. Computing DIO in October, after the Q4 buy landed and before Q4 sales, reads catastrophic. The same store in January reads lean. Neither read says anything a buyer can act on without the window written next to it.
And the sell rate in the denominator is history. DIO prices the shelf at the rate you sold, not the rate you will sell. A trend that is fading holds more real days than the formula shows.
The operator's version of the number
Keep the unit. Change the grain. Days per SKU at the current sell rate is the number that runs a store.
- Export stock value and units per SKU, plus the last eight weeks of sales.
- Compute days of cover per SKU: units on hand over daily unit sales. Value-weight it later; start with units.
- Sort descending by stock value and read two lists: rows under 30 days, rows over 120.
- The under-30 list is your reorder queue. Check it against safety stock and reorder points before the fast rows go empty.
- The over-120 list is your cash. Decide each row on purpose: hold for season, bundle it, or cut price while it still moves at all.
Run it monthly and the store-level DIO becomes what it should be: a summary you report, computed from decisions you already made row by row, instead of a number you discover.
What a good DIO is
The honest range: replenishment-led DTC tends to sit between 45 and 90 days. Seasonal catalogues run heavier into a launch and lighter out of it. High-ticket, slow-cadence categories live above 120 and that can be correct.
But the store-level target is the least useful version of the answer. The useful version: no revenue-critical SKU under its lead-time floor, no cash-heavy SKU drifting past your markdown horizon, and the value-weighted average falling out of those two rules. Get the rows right and the average takes care of itself.
The trend is stricter than the level. DIO rising three months in a row while revenue is flat means the buys are outrunning the sales. That is the earliest honest signal that a markdown season is coming, and demand forecasting built on those inflated buys will inherit the error.
What's missing
This page can hand you the formula, the finance framing, and the per-SKU read. It cannot tell you which of your rows crossed 120 days last week, because that lives on your catalogue, your costs, and your sell rates.
SkuSense is being built to keep that read running for Shopify brands: days of cover per SKU, the under-30 and over-120 lists, and the drift between months, without the export.
Related: What is a good inventory turnover ratio? · Dead stock in ecommerce · Safety stock and reorder points